Spot gold traded near 1,193 dollars per ounce, edging lower as investors adopted a cautious stance ahead of this week’s Federal Reserve policy meeting. Markets increasingly expect the Fed to deliver a “hawkish rate cut”, keeping uncertainty elevated until clearer guidance emerges.
WTI crude traded near 58.85 dollars per barrel, sliding more than 2 percent after production resumed at a major Iraqi oilfield while markets continued to track developments in Ukraine peace talks.
Gold
Gold prices slipped on Monday as traders stayed on the sidelines ahead of the Fed decision. Spot gold dipped 0.2 percent to 1,189.49 dollars per ounce.
Markets overwhelmingly expect a 25 basis-point rate cut at Wednesday’s meeting, with traders pricing in an 89 percent probability. Analysts noted that while gold faces short-term pressure, the broader bullish outlook remains intact thanks to strong central-bank buying, a potentially weaker dollar, and persistent geopolitical demand.
Technical View
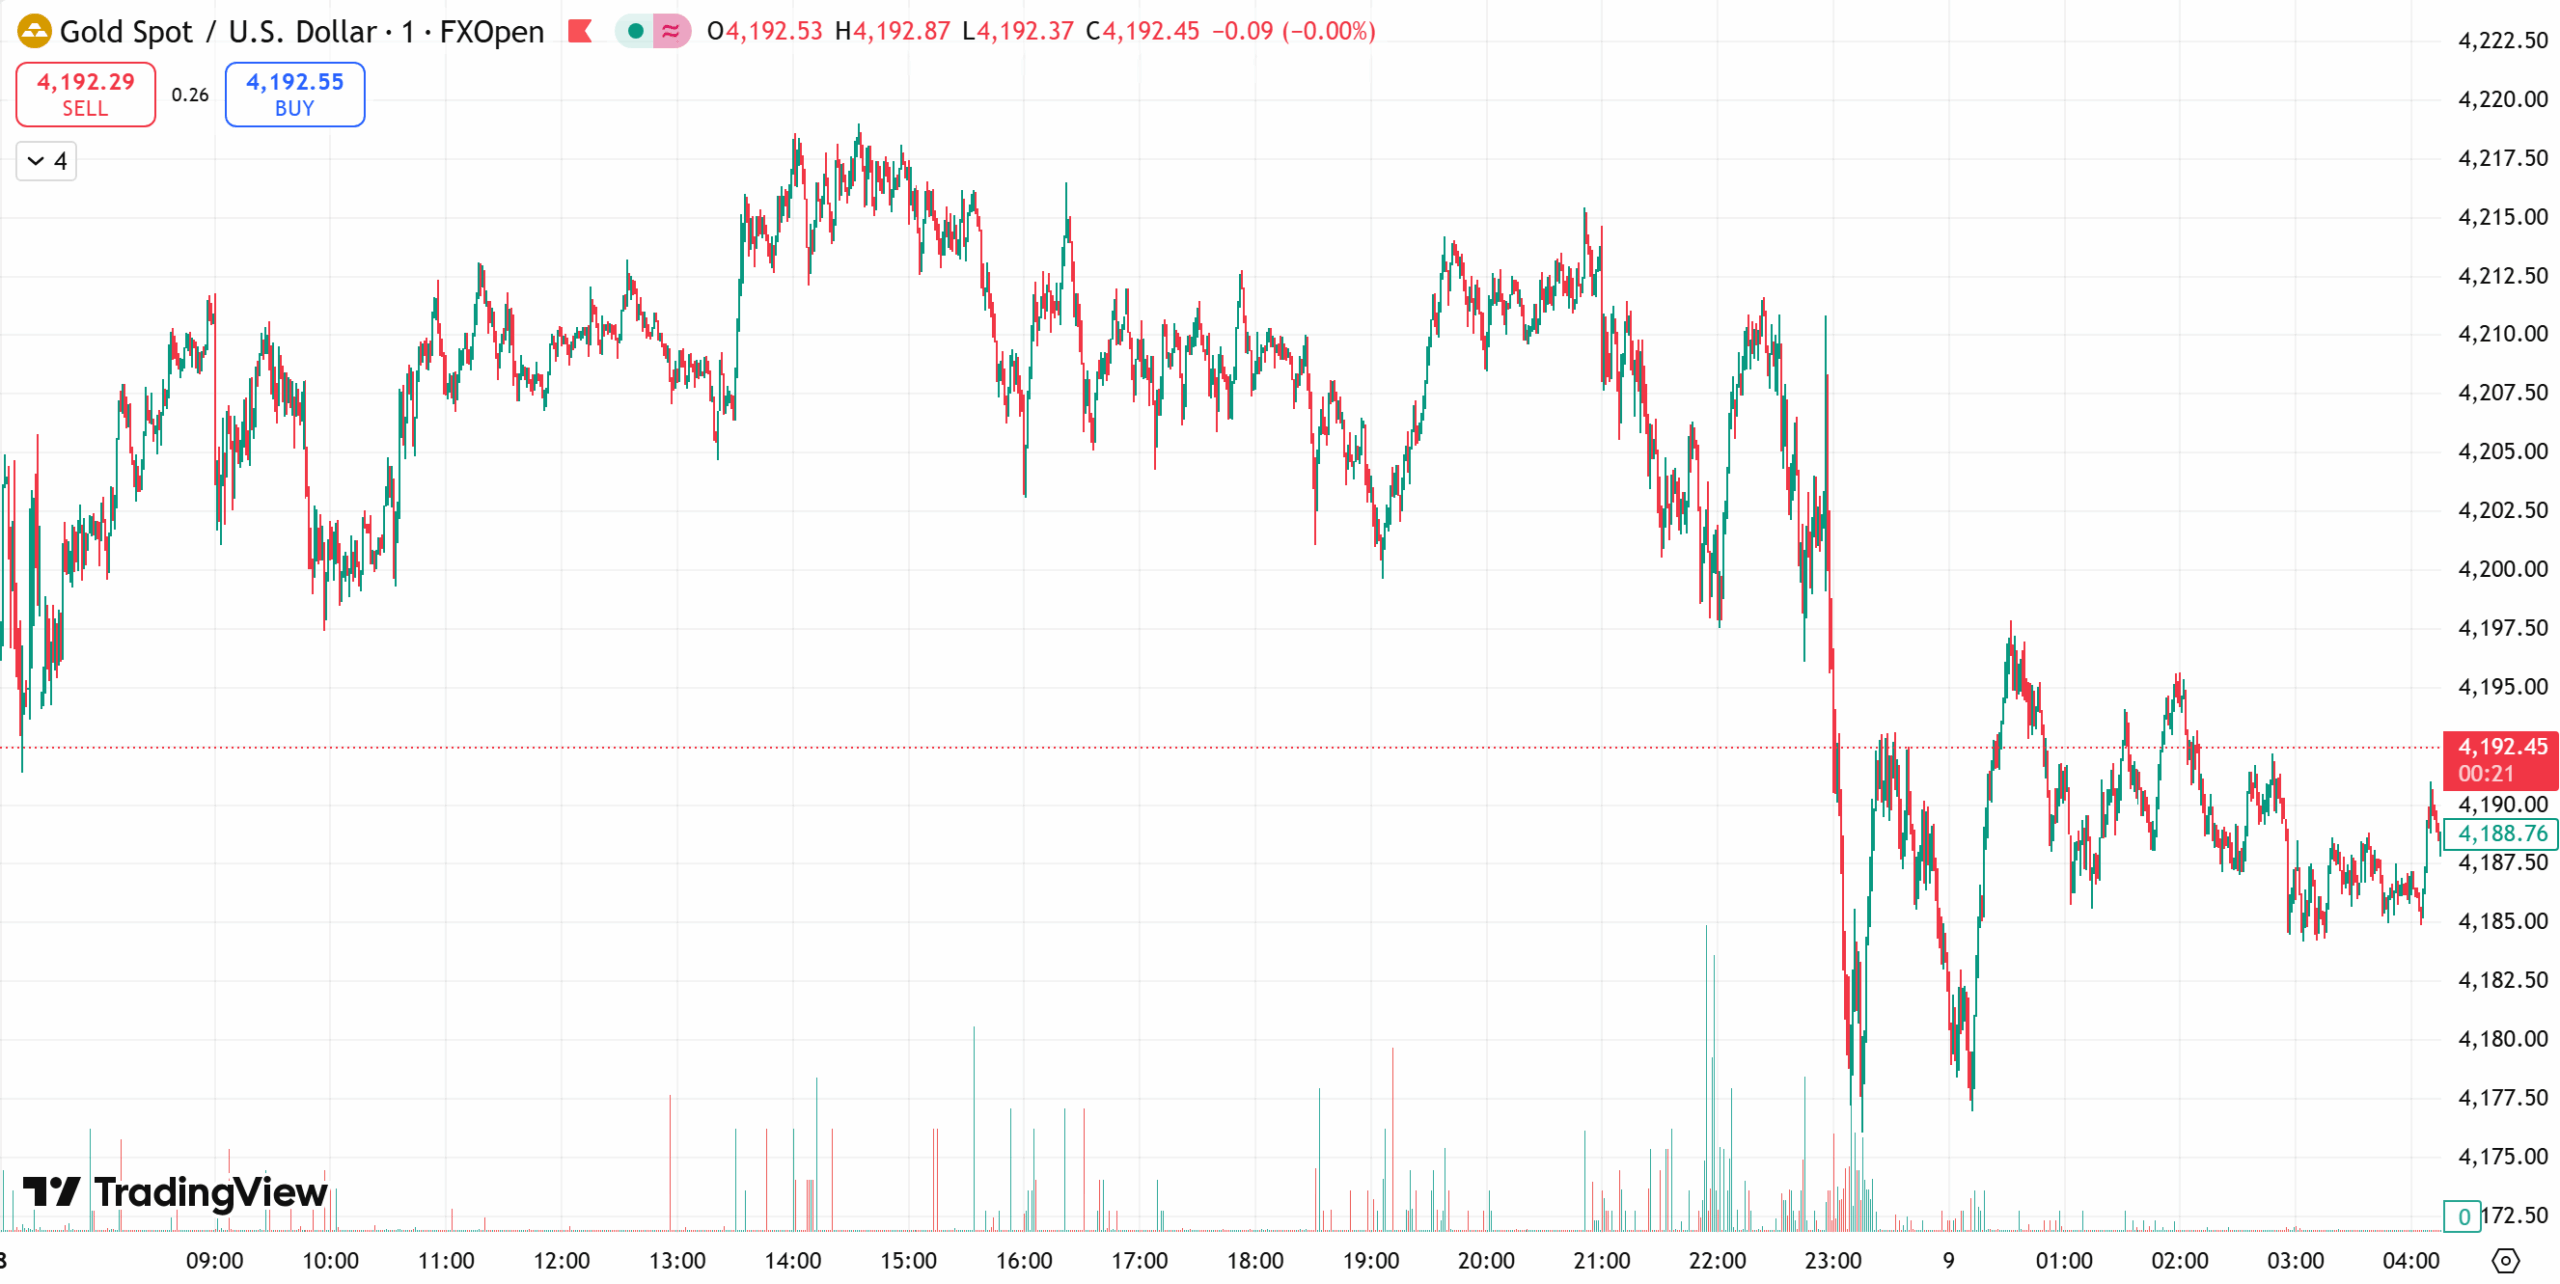
Gold remains in an uptrend but momentum is fading, increasing the risk of a short-term pullback. The 4175–4200 zone is the key support area, marking recent lows and the core of last week’s price structure.
A decisive break below this zone could shift focus toward the 4100 level, a major psychological and structural support and the starting point of the latest rally.
Upside resistance stands at 4220–4270, a zone that has repeatedly rejected advances. A breakout above this region would reopen the path toward all-time highs.
Intraday bias remains to buy dips and sell rallies.
Today’s Levels
Trading bias: Buy the pullback, sell the bounce
Resistance: 4220–4240
Support: 4170–4150
Crude Oil
Oil prices dropped more than 2 percent Monday after Iraq’s West Qurna-2 field resumed operations, restoring roughly 460,000 barrels per day of output.
Sentiment was further influenced by progress, or lack thereof, in Ukraine peace discussions, which could reshape expectations for Russian exports.
Brent settled 1.98 percent lower at 62.49 dollars, while WTI fell 2 percent to 58.88 dollars.
Technical View
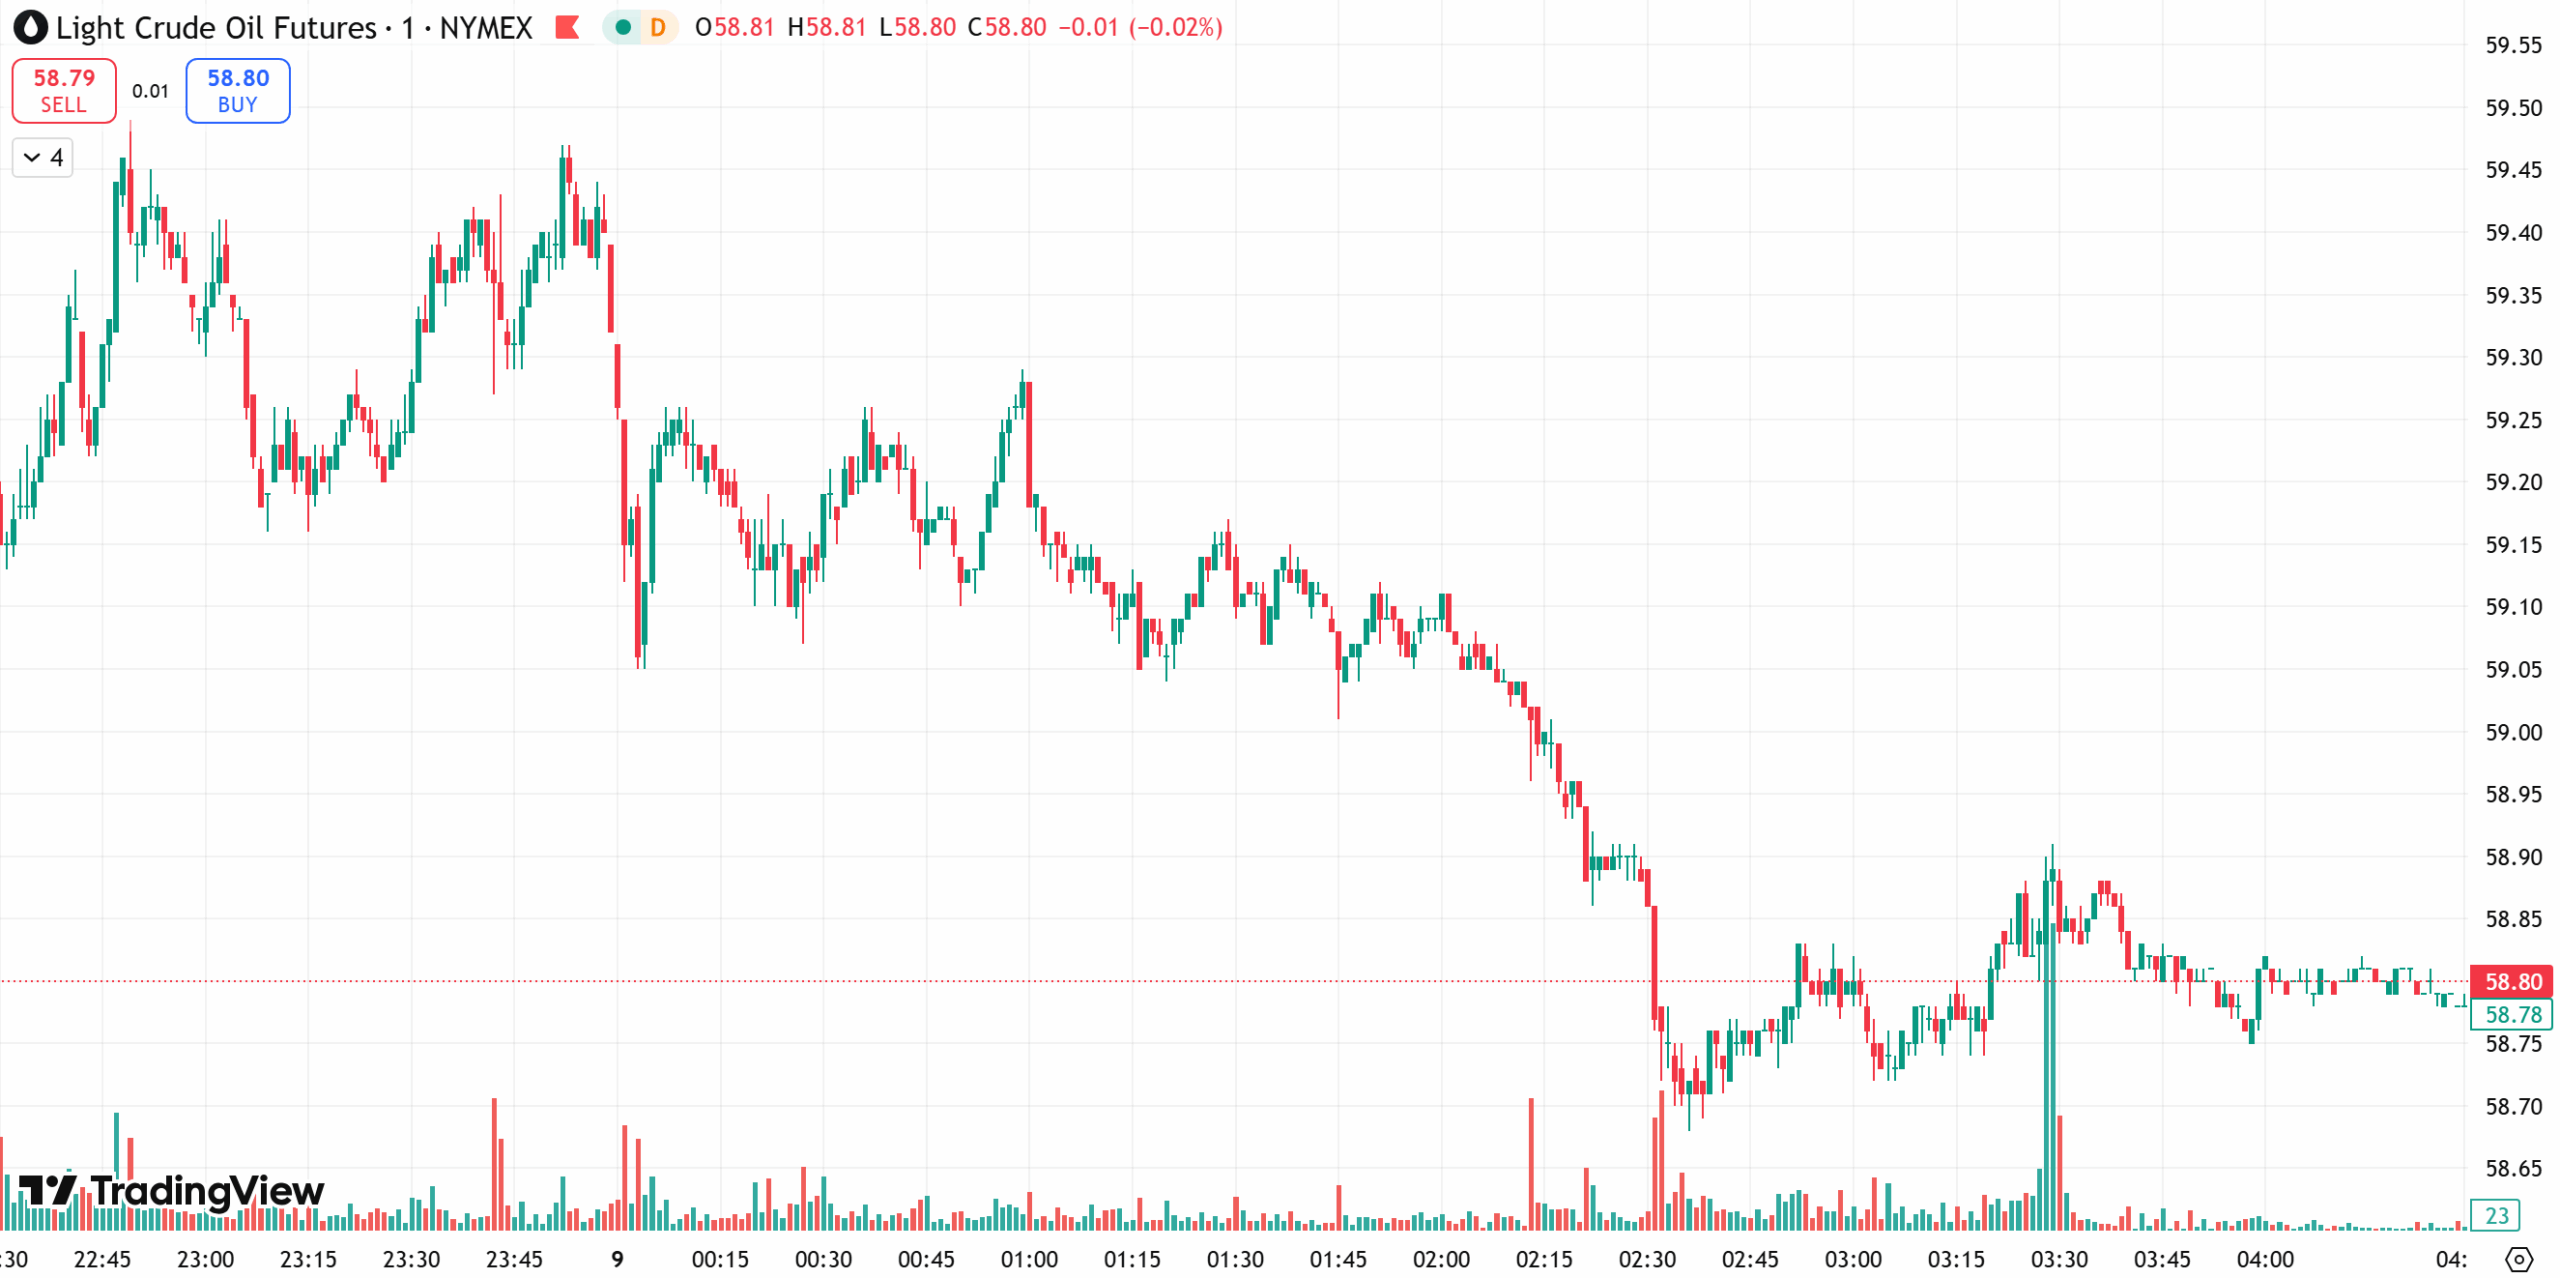
On the daily chart, crude remains in a secondary corrective phase. Multi-day alternating candles and MACD hesitations reflect weak bearish momentum, but the broader structure still leans toward a test of 56 dollars.
Short-term (1H) price action shows wide-range consolidation within an ascending channel. Momentum signals are weakening, increasing the probability of a downside resolution once today’s consolidation phase completes.
Overall bias: Expect intraday volatility with a tilt toward renewed downside.
Today’s Levels
Trading bias: Sell the bounce, buy the pullback
Resistance: 60.0–61.0
Support: 57.5–56.5
Risk Disclosure
Trading Securities, Futures, CFDs and other financial products involve high risks due to the rapid and unpredictable fluctuation in the value and prices of these underlying financial instruments. This unpredictability is due to the adverse and unpredictable market movements, geopolitical events, economic data releases, and other unforeseen circumstances. You may sustain substantial losses including losses exceeding your initial investment within a short period of time.
You are strongly advised to fully understand the nature and inherent risks of trading with the respective financial instrument before engaging in any transactions with us. When you engage in transactions with us, you acknowledge that you are aware of and accept these risks. You should conduct your own research and consult with an independent qualified financial advisor or professional before making any financial, trading or investment decisions. This blog may contain speculative statements regarding future expectations, plans, or projections based on information and assumptions currently available to D Prime. Although D Prime considers these assumptions reasonable, such statements involve risks, uncertainties, and factors beyond D Prime’s control, and actual outcomes may differ significantly.
Disclaimer
This information contained in this blog is for general informational purposes only and should not be considered as financial, investment, legal, tax or any other form of professional advice, recommendation, an offer, or an invitation to buy or sell any financial instruments. The content herein, including but not limited to data, analyses and market commentary, is presented based on internal records and/or publicly available information and may be subject to change or revision at anytime without notice and it does not consider any specific recipient’s investment objectives or financial situation. Past performance references are not reliable indicators of future performance.
D Prime and its affiliates make no representations or warranties about the accuracy or completeness of this information and disclaim any and all liability for any direct, indirect, incidental, consequential, or other losses or damages arising out of or in connection with the use of or reliance on any information contained in this blog. The above information should not be used or considered as the basis for any trading decisions or as an invitation to engage in any transaction.
D Prime does not guarantee the accuracy or completeness of this report and assumes no responsibility for any losses resulting from the use of this report. Do not rely on this report to replace your independent judgment. You should conduct your own research and consult with an independent qualified financial advisor or professional before making any financial, trading or investment decisions.